
Every Ash Wednesday and Easter, Port of Spain and Kingston come alive. Road march costumes, bass-heavy soca (sprinkled with a “little” or “too much” Dancehall), and fete culture takes over the vibrant cities. But beneath the spectacle, a more important story is unfolding. Carnival in Jamaica and Trinidad is no longer just entertainment. It is a measurable, growing, and increasingly well-documented economic sector. More specifically, when you place Jamaica’s performance next to the broader Caribbean landscape, the data reveals something that investors, policymakers, and regional development partners should be paying close attention to.
We do not think the conversation has moved far enough from culture into commerce. This article examines what the numbers actually say, applies a structured analytical framework, and draws out the strategic implications for the region. We will start by looking at Jamaica, where a data-driven structured approach is revealing crucial insights and zoom out to the wider Caribbean and how the numbers tell a story that cannot be ignored.
Jamaica’s Carnival Economy: The 2025 Numbers
In March 2026, Minister of Tourism Edmund Bartlett announced the findings from the Carnival in Jamaica Economic Impact Assessment, conducted by researchers Dr. Michael Marshall and Dr. Stephen Johnson of the Centre for Leadership and Governance at The University of the West Indies, Mona (Jamaica Information Service [JIS], 2026). The headline figure was J$165.7 billion in total economic impact generated by Carnival 2025, a 48% increase over the J$111.7 billion recorded in 2024 (Observer, 2026).
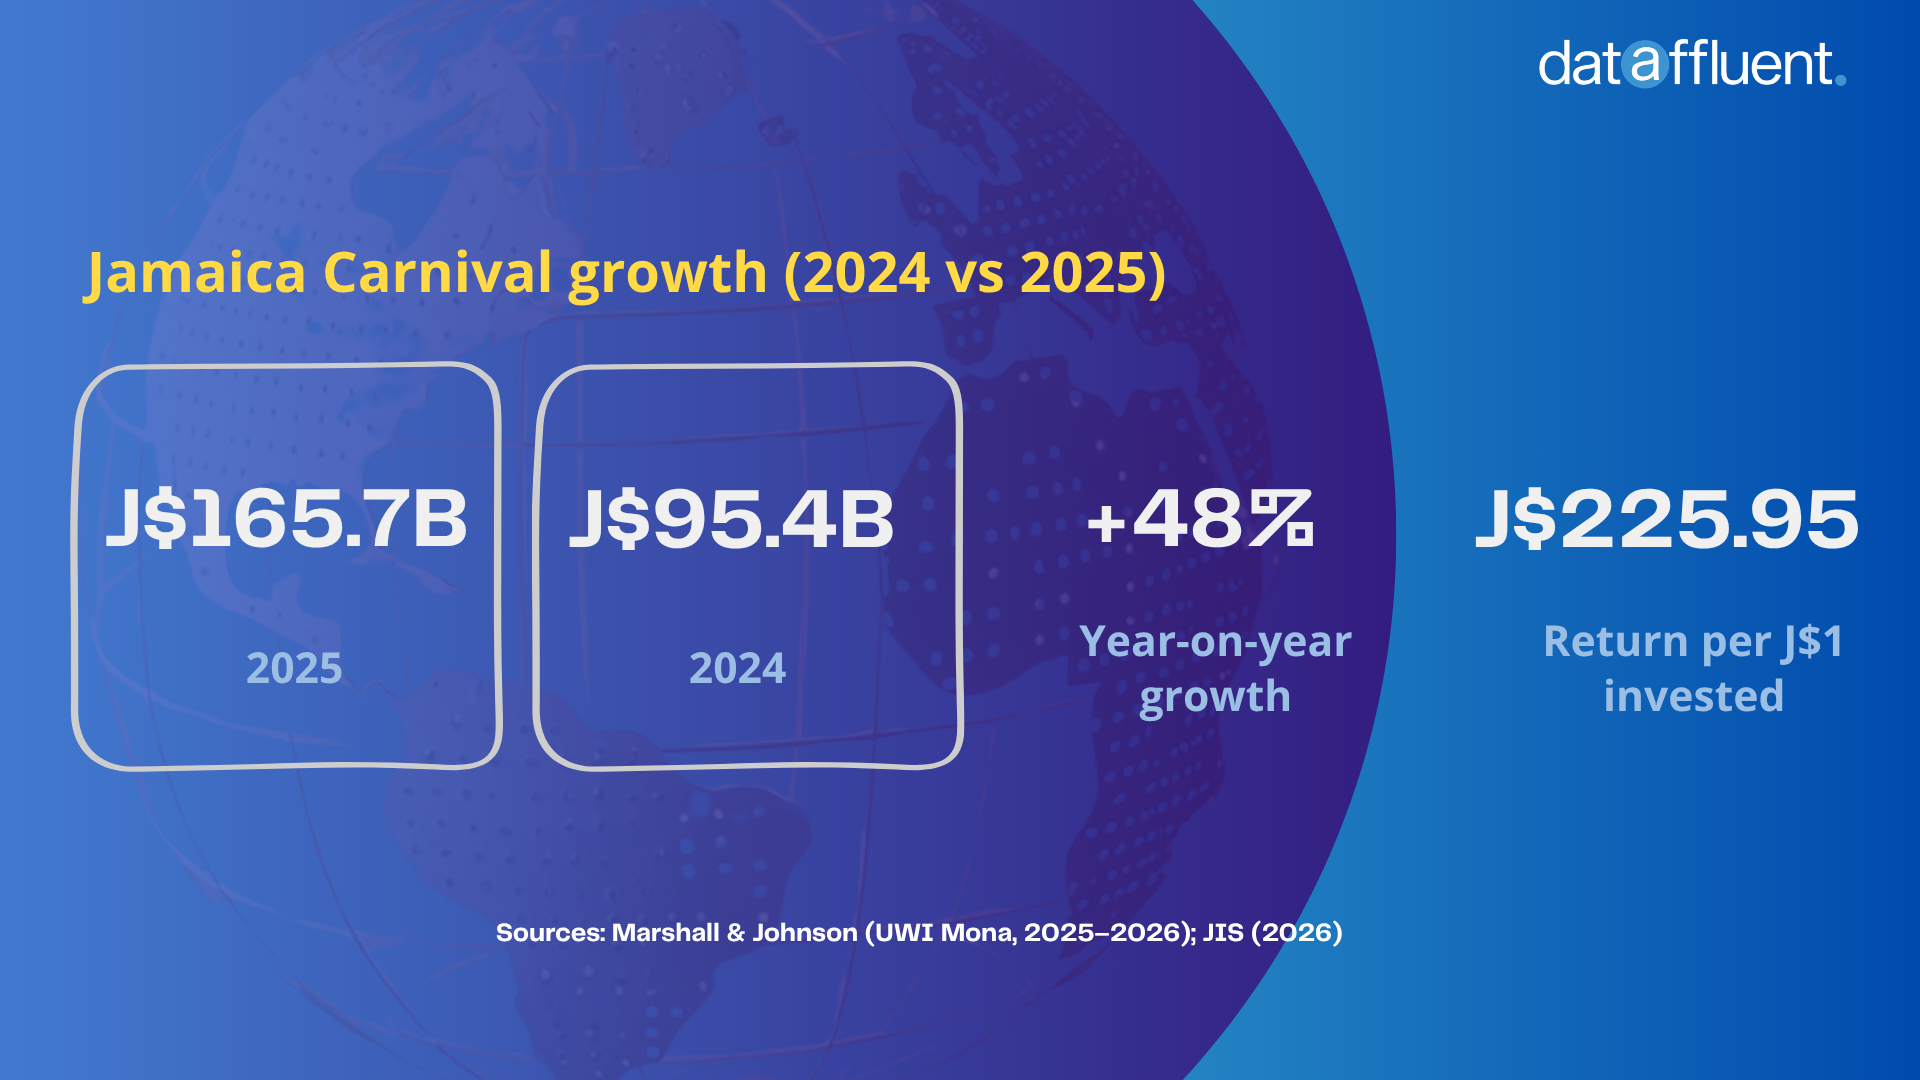
These are not marginal improvements. Consider what sits beneath that aggregate number. Overseas visitors spent an average of US$5,320.89 per person in 2025, up from US$3,209 in 2024, producing estimated direct overseas visitor spending of US$23.6 million (J$3.76 billion) (JIS, 2026). Among first-time international visitors, 78.7% said they came to Jamaica specifically for Carnival. Among repeat visitors, that figure rose to 87.7% (JIS, 2026). Carnival is not incidental to Jamaica’s tourism proposition. For this visitor segment, it is the proposition.
Local revellers contributed J$3.10 billion in direct spending, at approximately J$433,302 per person across an estimated 7,400 participants (JIS, 2026). Direct spending across both cohorts reached J$7.7 billion, and when the multiplier effects are applied, every Jamaican dollar invested in Carnival generated approximately J$225.95 in economic benefit (JIS, 2026). Across the 2019, 2023, and 2024 study period, the average return was J$159.09 per dollar spent (Travel Daily News, 2025).
The event also supported approximately 200,099 full-time-equivalent jobs and generated J$33.2 billion in household income in 2025 alone (JIS, 2026). These are sectoral employment figures comparable to mid-sized manufacturing operations, except they are driven entirely by culture, creativity, and music.
The Analytical Framework: How to Compare Carnival Economies
Raw revenue figures tell only part of the story. To understand where each destination sits competitively, we apply a framework drawn from the Tourism Satellite Account (TSA) methodology developed by the United Nations World Tourism Organization (UNWTO, 2010). The TSA framework allows for cross-country comparisons across four core pillars: direct visitor spend, scale of participation, indirect supply chain impact, and investment yield efficiency.
This approach moves the analysis beyond total revenue to examine visitor yield, the mix of local versus international economic circulation, and how effectively each dollar of public or private investment is multiplied through the broader economy. It is the difference between knowing how much a festival earns and understanding what kind of economy it builds.
Regional Comparison: Trinidad, Barbados, St. Lucia, and Brazil
The table below summarises key metrics across the major carnival markets in 2024 and 2025, drawing on official government data and recent institutional research.
| Metric | Jamaica Carnival | Trinidad Carnival | Barbados Crop Over | Brazil Carnival (Rio) |
|---|---|---|---|---|
| Overseas Visitors (approx.) | ~5,400 (2025) | ~41,022 (2025) | ~8,500 to 10,000 (2024) | 200,000+ international (2025) |
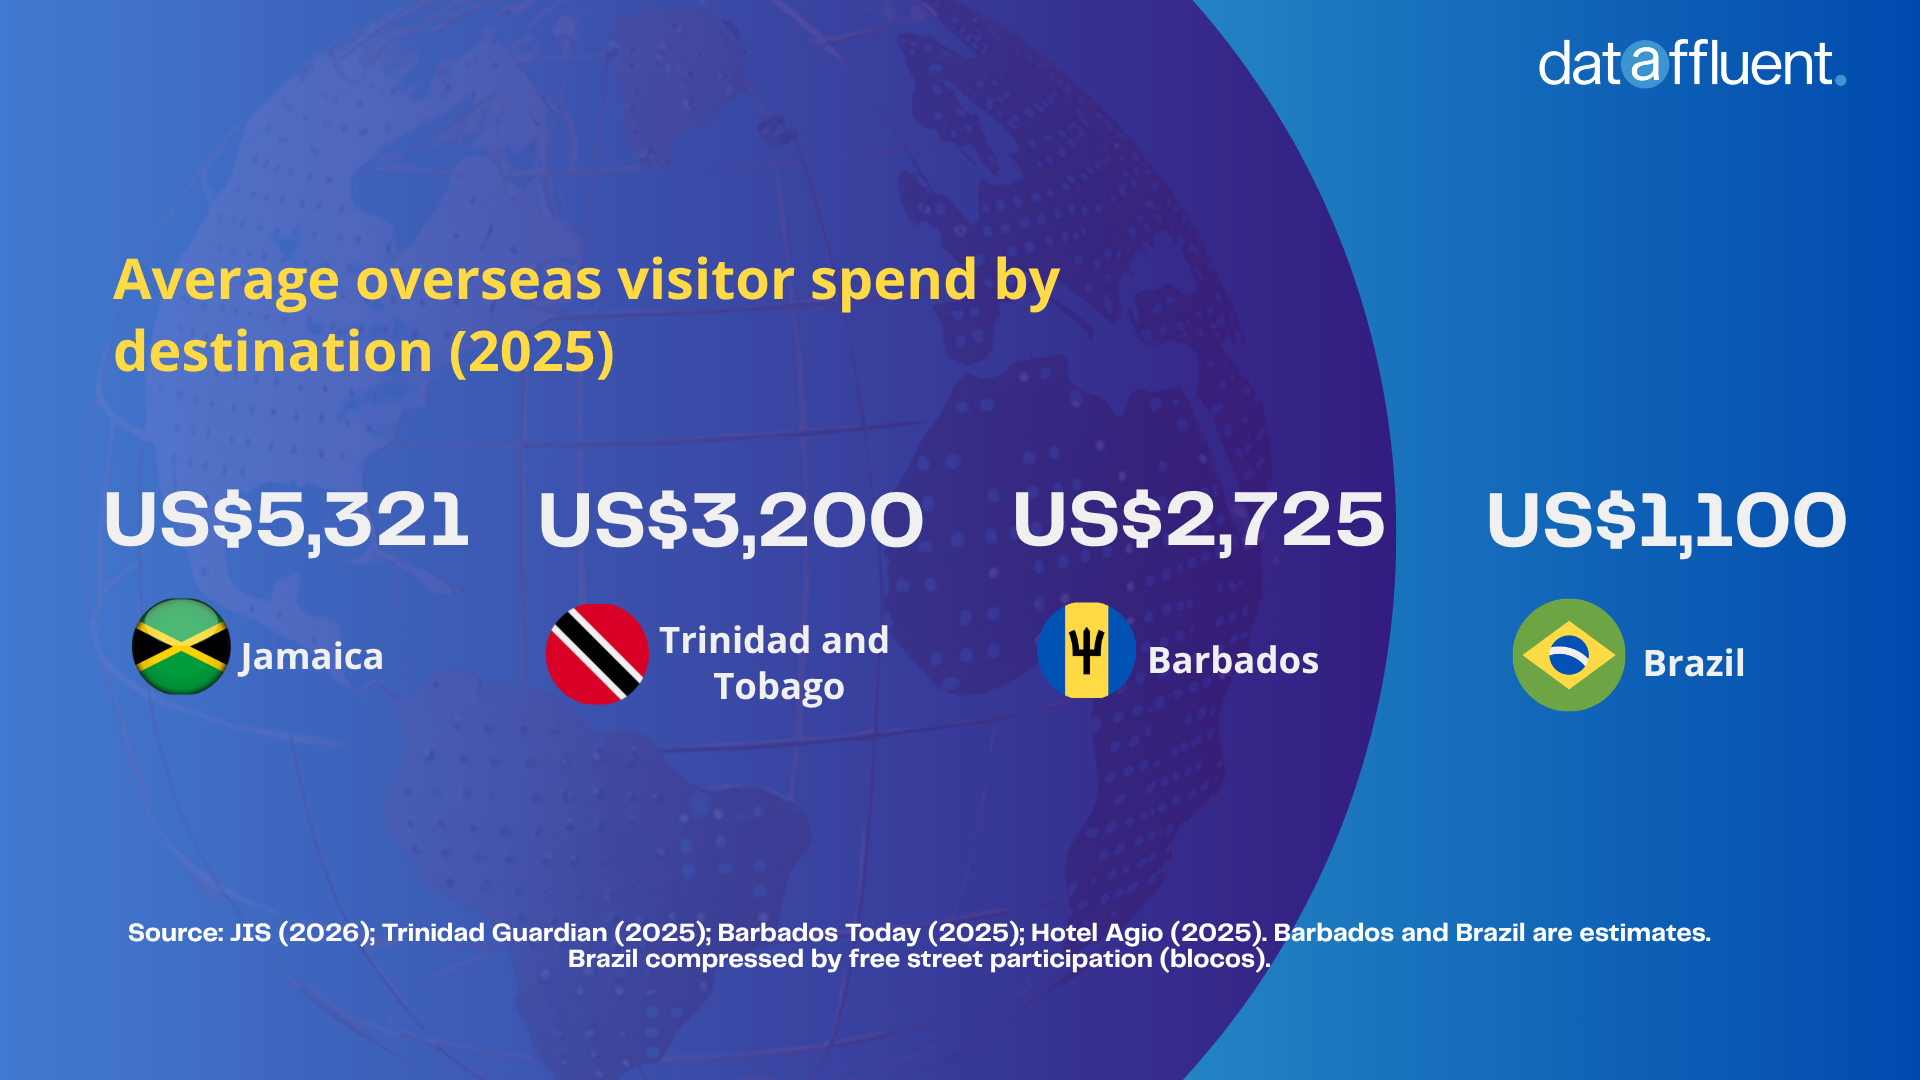
| Avg. Overseas Spend (USD) | US$5,321 | US$2,265 to ~US$3,200 (TTD$15,336 at approx. 6.77 rate) | Estimated US$2,450 to 3,000 | Estimated US$1,000 to 1,200 |
| Total Direct Visitor Spend | US$23.6 million | US$98.6M+ (TTD$668M at approx. 6.77 rate) | Estimated US$30 to 40 million | R$5.7 billion (Rio only, 2025) |
| Investment Multiplier | J$225.95 per J$1 | High (not formally published) | Estimated ~1% of GDP annually | Massive (national CNC estimate: R$12.03B, 2025) |
| Measurement Status | Formal academic study (UWI, 2025 and 2026) | IDB assessment initiated (2025) | No formal multiplier study conducted | CNC annual national estimate |
Sources: JIS (2026); Trinidad and Tobago Ministry of Tourism, Culture and the Arts (2025); Barbados Today (2025); Barbados Underground (2024); Hotel Agio (2025); Inter-American Development Bank (2026).
What the Data Actually Reveals
Jamaica Leads on Yield per Visitor
At US$5,320.89 per overseas visitor in 2025, Jamaica now records the highest average spend per international carnival attendee in the Caribbean (JIS, 2026). Trinidad’s exit surveys for Carnival 2025 put average visitor spend at TTD$15,336, which converts to approximately US$2,269 at current exchange rates (Trinidad Guardian, 2025) and other sources estimate it to be approximately US$3,200. Both figures sit well above the estimated US$1,000 to US$1,200 average for international visitors to Brazil’s Carnival, where the prevalence of free street events (blocos) compresses the per-person average significantly (Hotel Agio, 2025).
High yield per visitor matters in a small island context. Jamaica does not have the physical capacity to host hundreds of thousands of carnival tourists simultaneously. The strategic lever is spending quality, not sheer volume. The 2025 data confirms that Jamaica’s carnival visitor is a high-value, repeat-motivated traveller. That is the profile to scale.
Trinidad Leads on Scale, But Faces Measurement Gaps
With an estimated 41,022 air arrivals during the 2025 Carnival window and total visitor spending of TTD$668 million (approximately US$98.6 million), Trinidad and Tobago remains the regional leader in scale and gross visitor revenue (Trinidad Guardian, 2025). The Inter-American Development Bank (IDB) has formally recognised this, noting that Trinidad Carnival attracts over 40,000 international visitors annually and generates approximately US$90 to US$95 million in visitor expenditure in a typical year (IDB, 2026).
However, the IDB has also acknowledged that the full multiplier effect remains unmeasured. Since 2025, through the Economic Assessment of Carnival in Trinidad and Tobago Project, the IDB has been developing a methodology to capture carnival’s socio-economic, tourism, and cultural contributions in full (IDB, 2026). This is the same kind of systematic measurement that Jamaica completed first. We expect that when those multiplier figures are formalised, they will confirm what practitioners already know: Carnival is infrastructure-class investment for Trinidad’s creative economy.
Barbados Has a Measurement Problem
Barbados Crop Over generates an estimated BDS$100 million annually in economic activity, representing just over 1% of the island’s approximately BDS$8 billion GDP (Barbados Today, 2025). The Barbados Central Bank identifies Crop Over as one of the island’s key event-driven tourism demand drivers, supporting long-stay arrivals and seasonal spend (Central Bank of Barbados, 2025).
But Barbados does not yet have a formal economic impact multiplier study comparable to what Jamaica and Trinidad are now building. As the Barbados Underground commentary pointed out, the absence of a structured assessment means the island is, in effect, guessing at the real value of its most important cultural export (Barbados Underground, 2024). Trinidad’s 2024 report put its visitor expenditure at approximately US$94.2 million; Brazil’s 2024 estimate from the National Confederation of Commerce was US$1.84 billion. Barbados, with one of the Caribbean’s most sophisticated financial and academic institutions, does not yet have a comparable baseline (Barbados Underground, 2024).
This is not a minor gap. Without measurement, there is no evidence base for policy investment, private sector partnership, or international development financing.
Brazil Operates at a Different Scale Entirely
Brazil’s Carnival is a different class of event economically. Rio’s city government estimated R$5.7 billion (approximately US$1.1 billion) in economic activity from Carnival 2025 alone, with approximately 118,000 foreign tourists in the Rio window and roughly 50,000 temporary jobs created in the city (Hotel Agio, 2025). The Brazilian National Confederation of Commerce projected R$12.03 billion in national Carnival-related revenue for 2025, up approximately 2.1% year-on-year (Hotel Agio, 2025).
The important caveat is that Brazil’s high volume of free public street participation compresses the international yield per visitor. The model is mass access at low price point, which maximises domestic economic circulation but produces a lower foreign exchange yield per international arrival than the West Indian costume-and-fete model. Neither is superior in absolute terms. They serve different strategic purposes and reflect different cost structures. But for small island economies where foreign exchange earnings are a primary development priority, yield per visitor carries more policy weight than raw attendance figures.
The Strategic Argument for Data-Driven Carnival Investment
The IDB has framed this clearly. In a May 2026 blog post, the bank stated that to maximise the economic impact of carnivals, countries should treat them as economic infrastructure, and called for stronger data and measurement frameworks, policies integrating carnival into national tourism strategies, and financing for infrastructure and capacity-building that benefits local MSMEs and creative industries beyond the festival season (IDB, 2026).
We agree with that framing. Jamaica is already operationalising it. The UWI Mona economic impact assessments commissioned through the Tourism Enhancement Fund, covering 2018 to 2025, now give Jamaica something rare in the Caribbean tourism economy: a time-series dataset on cultural event economics. That is a fundable, investable, policy-actionable evidence base.
The question for the rest of the region is whether other governments move at the same pace. Barbados has the institutional capacity to build an equivalent framework. Trinidad is actively doing so with IDB support. St. Lucia, which has positioned itself as a boutique carnival destination with strong repeat-visitor loyalty among event-circuit attendees, would benefit significantly from formal visitor yield measurement to support investment in event production infrastructure.
What Investors and Development Partners Should Watch
For investors and development finance institutions looking at the Caribbean creative economy, three signals stand out from this data cycle.
First, repeat-visitor loyalty is a structural asset. When 87.7% of repeat international visitors say Carnival is the reason they came back to Jamaica, that is a demand signal with compounding value (JIS, 2026). It points toward opportunities in year-round brand infrastructure: accommodation partnerships, digital event ticketing platforms, costume production supply chains, and destination marketing that extends the Carnival brand outside the Easter window.
Second, the measurement gap is itself an opportunity. Barbados, St. Lucia, and other carnival economies that lack formal multiplier studies represent a near-term market for data and analytics services that can support evidence-based policy. This is an area where Dataffluent’s work in AI-powered insights for emerging markets is directly relevant. We are watching this space closely.
Third, labour formalisation within carnival production supply chains remains underexplored. The 2025 Jamaica data documents approximately 200,099 full-time-equivalent jobs (JIS, 2026). The majority of these are seasonal and informal. The development finance literature on labour formalisation is clear: formalising workers in high-growth informal sectors increases productivity, expands the tax base, and enables access to financing (IDB, 2025). Carnival economics is an underexplored entry point for that broader policy conversation in the Caribbean.
Conclusion
Carnival is not soft investment. It is not cultural expenditure that defies measurement. The 2025 Jamaica data, the Trinidad IDB framework, and even Brazil’s CNC national estimates confirm that these events generate quantifiable, scalable economic value. They drive foreign exchange earnings, household income, employment, and supply chain activation across multiple sectors.
The region’s challenge is not generating that value. Carnival has always done that. The challenge is measuring it rigorously, reporting it consistently, and using the evidence to attract the investment-grade attention these events deserve.
Jamaica is showing the region how that is done. The numbers are speaking. We are listening.
About Dataffluent
Dataffluent is a Techstars-backed data science and analytics company headquartered in Kingston, Jamaica. We build data products and analytical solutions that help financial institutions, investors, and businesses across underserved emerging markets move from raw data to decisions that drive measurable results. Our flagship product is a financial analyst platform purpose-built for the Caribbean capital markets. The platform delivers fundamental analysis of publicly traded companies across the region, combining machine learning-driven sentiment analysis, and macroeconomic predictions covering inflation, interest rates, and foreign exchange movements. For analysts, portfolio managers, and institutional investors operating in markets where reliable, region-specific intelligence has historically been hard to come by, this fills a critical gap. We understand the market we operate in. Fragmented data environments, thin public disclosure requirements, and the unique macroeconomic dynamics of small open economies are not edge cases for us. They are the conditions our models are trained on, and our platform is built for. Join our beta waitlist or book a demo to learn more.
References
Barbados Today. (2025, February 26). Tourism soars: Record-breaking visitor numbers in 2024. Barbados Today. https://barbadostoday.bb/2025/02/26/tourism-soars-record-breaking-visitor-numbers-in-2024/
Barbados Today. (2025, July 15). Monetising the national Crop Over Festival. Barbados Today. https://barbadostoday.bb/2025/07/15/monetising-the-national-crop-over-festival/
Barbados Underground. (2024, August 4). 50 years of Crop Over: Hit or miss? Barbados Underground. https://barbadosunderground.net/2024/08/04/50-years-of-crop-over-hit-or-miss/
Caribbean National Weekly. (2025, April 28). Carnival in Jamaica generated J$95.4 billion in 2024. Caribbean National Weekly. https://www.caribbeannationalweekly.com/news/carnival-in-jamaica-generated-j95-4-billion-in-2024/
Caribbean National Weekly. (2026, March 12). Jamaica Carnival drives J$165.7 billion economic impact in 2025. Caribbean National Weekly. https://www.caribbeannationalweekly.com/entertainment/jamaica-carnival-drives-j165-7-billion-economic-impact-in-2025/
Central Bank of Barbados. (2025, May). Updated outlook for Barbados’ economy in 2025. Central Bank of Barbados. https://www.centralbank.org.bb/news/general-press-release/updated-outlook-for-barbados-economy-in-2025
Hotel Agio. (2025, December 26). 30+ Carnival tourism statistics [2025 edition]. Hotel Agio. https://hotelagio.com/carnival-tourism-statistics/
Inter-American Development Bank. (2025). Impact report 2025: Transforming for scale and impact. IDB Publications. https://publications.iadb.org/en/impact-report-2025-transforming-scale-and-impact
Inter-American Development Bank. (2026, May). How carnivals can become drivers of growth, jobs and tourism. IDB Blog. https://www.iadb.org/en/blog/science-technology-and-innovation/how-carnivals-can-become-drivers-growth-jobs-and-tourism
Jamaica Information Service. (2026, March 18). Carnival an economic engine: Minister Bartlett. JIS. https://jis.gov.jm/carnival-an-economic-engine-minister-bartlett/
Jamaica Observer. (2026, March 12). $165-B Carnival boom. Jamaica Observer. https://www.jamaicaobserver.com/2026/03/12/165-b-carnival-boom/
Travel Daily News. (2025, April 16). Carnival in Jamaica generates over J$95bn in economic output. Travel Daily News. https://www.traveldailynews.com/attractions/carnival-in-jamaica-generates-over-j95bn-in-economic-output/
Trinidad Guardian. (2025, April 6). $34M jump in visitor spend for Carnival 2025. Trinidad Guardian. https://www.guardian.co.tt/business/34m-jump-in-visitor-spend-for-carnival-2025-6.2.2274694.e6ed21a155
United Nations World Tourism Organization. (2010). Tourism satellite account: Recommended methodological framework 2008. UNWTO. https://www.e-unwto.org/doi/book/10.18111/9789211615203


0 Comments